Like the old adage about seeing the forest for the trees, it is sometimes difficult to see our own behavior within a broader context. You can look in the mirror, but how do you know if you've gained weight? A snapshot is not enough. You must step back and see a thing in context to understand it. But we must start by taking a snapshot. Then we take another, then another.
"If you can mention it, you can manage it." - Fred Rogers
I don't think anyone could say it better than Mr. Rogers. This is the ethos behind existing tools for tracking behavior: workout trackers, mood trackers, weight trackers. Being able to see our behavior gives us the option to manage it. Otherwise, we tend to hide from ourselves, allowing our behavior to slowly degrade. But if you frequently mention it, you can't hide from it. The available trackers on the market are a good place to start, but I generally find them to be inadequate if you want to track more than 1 thing. I've begun tracking my runs, the amount of alcohol I consume, the caffeine I consume, headaches I'm having, when I get sick, and more. The simple act of entering data is a way of daily recognition. Tracking is akin to journaling in this way. But it can do so much more.
In his 2016 book Pre-Suasion, Robert Cialdini discusses the difficulty of adhering to changing habits and one way to help. If your goal is to lose weight, you might make a mental commitment to stop eating sweets. But it can be difficult to adhere to that goal without a concrete method to anchor it. You may have a general sense that you should or shouldn't eat sweets, but how do you know for sure that you're eating fewer sweets? He suggests instead that we adopt an "If/when" strategy to anchor the behavior to an event: “If/when, after my business lunches, the server asks if I’d like to have dessert, then I will order mint tea.” This is a useful tactic for behavioral conditioning, the problem is that it requires us to be creative and to develop a new if/then clause for every situation that arrises frequently.
Tactics can only take you so far. I prefer the broader strategy of bringing attention to a behavior. A small behavioral change may be useful to accomplish your short term goals, but the same goal is difficult to maintain unless you develop a "real" awareness of the goal's context. The practice of tracking can help us to develop a real awareness of our behavior and to make the goal more natural. This kind of awareness has the power to create lasting change.
Our first objective when creating a new tracking log is to establish baseline. This can help us to answer questions about a single data set. For example, I can easily answer the question "Am I reducing my alcohol intake over time?" when I measure how many drinks I have. This way, I am building awareness and focusing on the larger trend instead of specific days. To do this, I set up a daily reminder using Apple's built-in reminder app (which is not my favorite app, but gets the job done), and I then enter my logs into a Notion spreadsheet every day. Some logs require a daily reminder like this, others I only enter when the event in question happens.
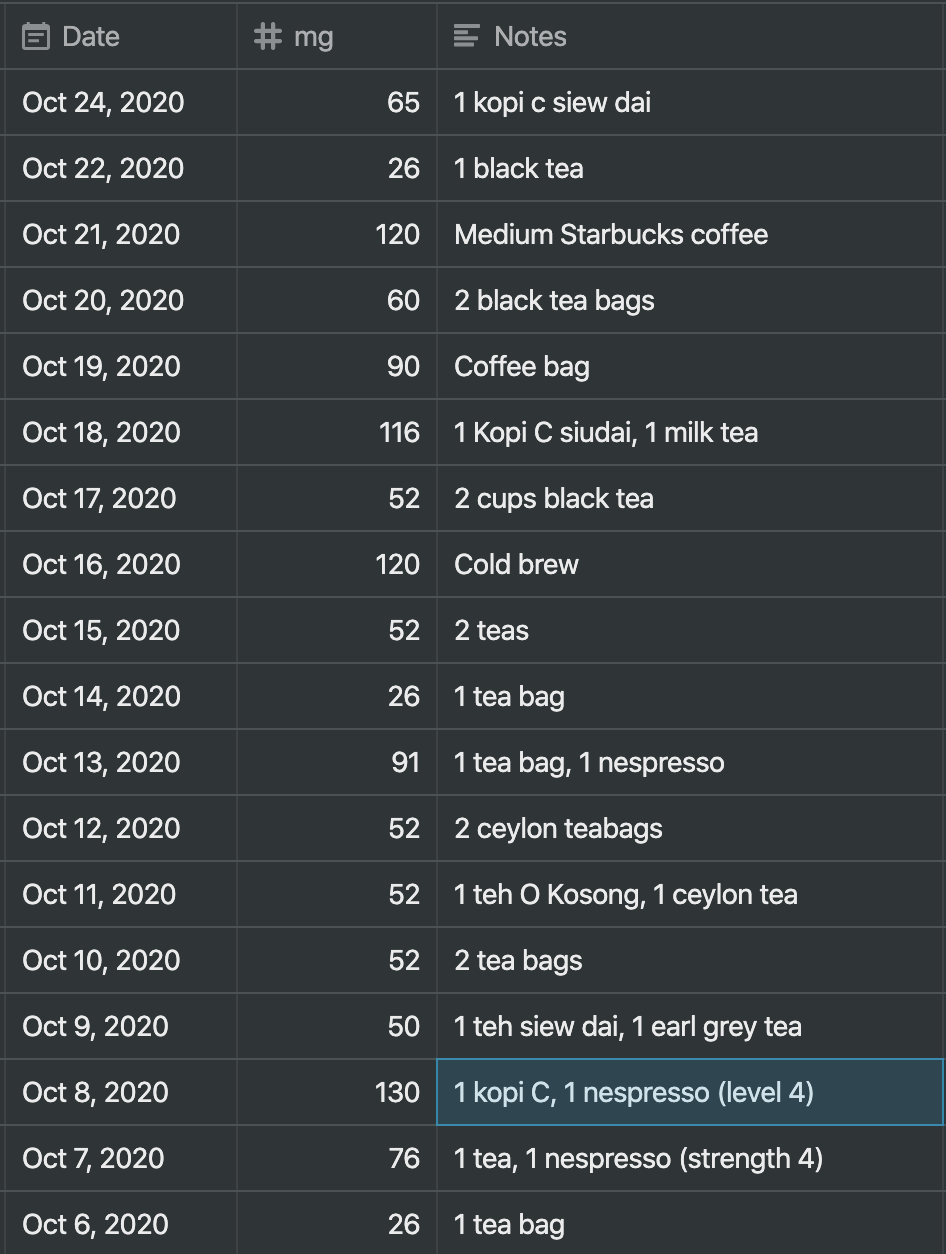
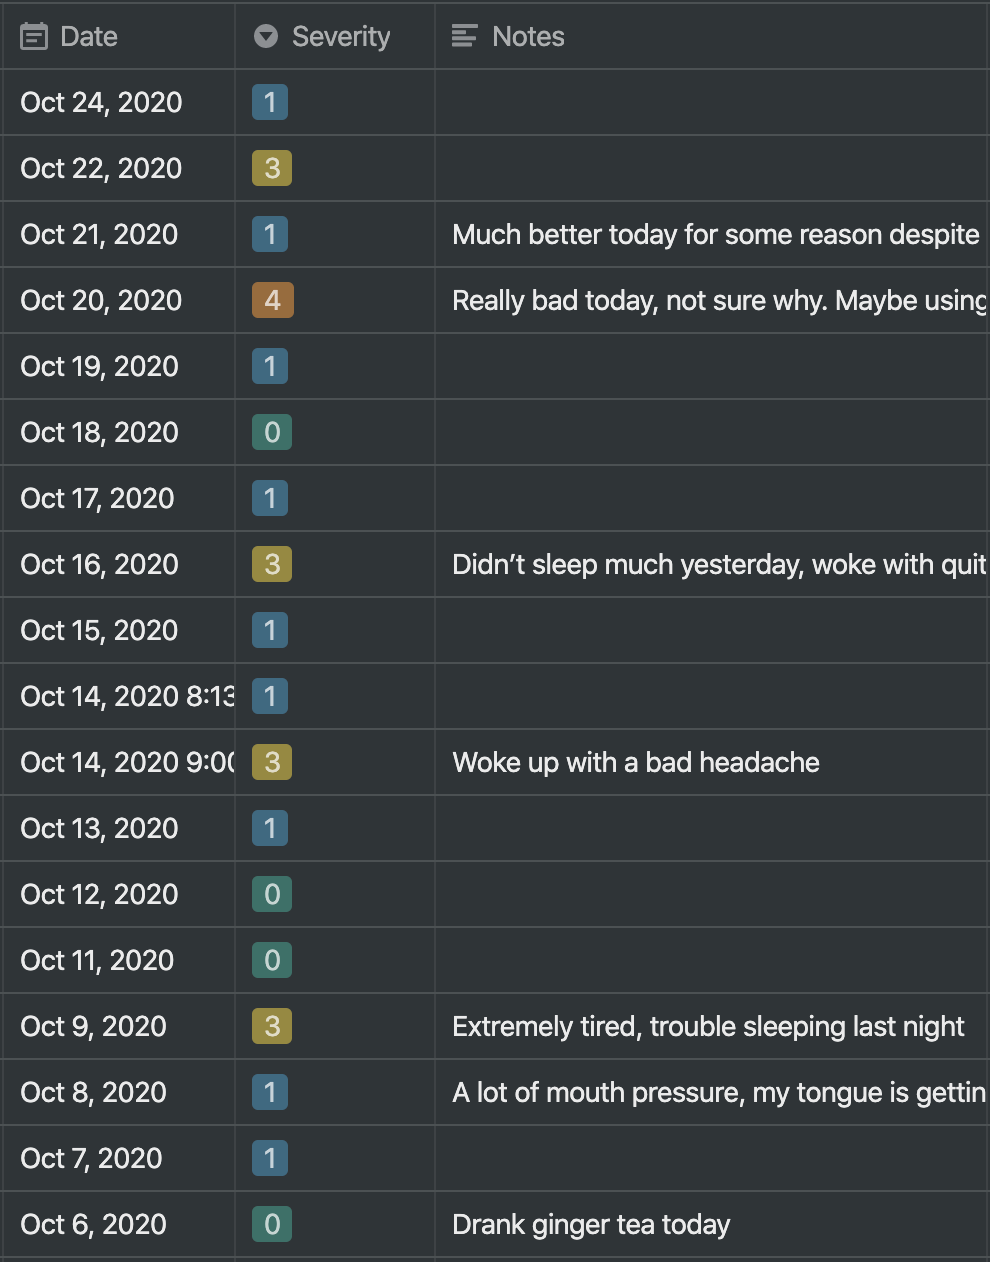
It gets more interesting the more you track, because you can then play with the data and also see the interplay of multiple metrics over time. As I mentioned, I am tracking both caffeine intake and headaches. I started having chronic headaches years ago, and I have tried a lot of things to reduce them, but nothing has worked. One day it occurred to me that the answer may be simpler than I was making it. The relationship between caffeine and headaches is well known. For some people, it can help subdue a headache. For others, it can cause them. But i was dubious, could it really be that simple? Turns out, yes it can. I have tracked my caffeine intake in mg and my headache severity on a scale of 0 to 5 for the past 10 months, and the data is pretty clear. Here are the spreadsheets I use:
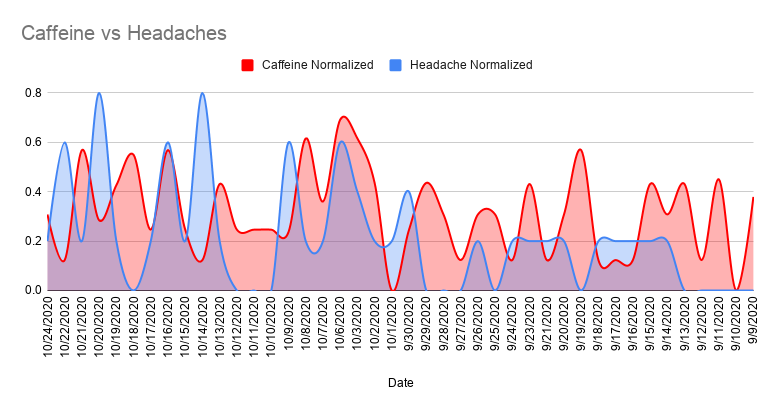
In order to see these 2 datasets together, I normalized both data sets to be between 0 and 1 with this formula: (value - min)/(max - min). My highest day's caffeine intake is 211mg, my lowest is 0mg. So for each data point, I normalize that value using (value - 0/(211 - 0) or value/211. I did the same for my headache severity and then plotted them together on a graph.

The results are hard to ignore. You can see that my headaches often follow days of high caffeine intake and usually trail by a day or so. I should note, this data is pretty raw, but it matches my hypothesis closely enough that I'm no longer surprised when I have a headache. I may still drink too much caffeine on some days, but at least I now know what I'm doing. I wouldn't be surprised if my quality of sleep is also heavily related to my caffeine intake, and I may soon try to find a way to measure that data as well.
To get started with your own trackers, simply create a spreadsheet wherever is most convenient. I use Notion, but Google Sheets is also great. One bonus of using Google Sheets is that you can easily visualize your data with graphs. I actually import my data into Google Sheets to visualize it, but I'm working on a custom app that will offload this work for me. In the end, the goal should be to see trends. I try not to be too hard on myself about the day to day. Instead, I'm trying to trend in a certain direction over time. Abraham Lincoln famously said "I walk slowly, but I never walk backward." Tracking our behavior can ensure that we walk forward, even if slowly. Just remember, if you can mention it, then you can manage it.